


Durable growth is the name of the game for growth stage companies in today’s macroeconomic environment. It’s the fine line between sustainable growth and profitability, between ambition and accountability. While previous posts have covered retention and go-to-market efficiency, there’s another critical lever that often gets overlooked: operating expenses (or “OpEx”).
The Role of Operating Expenses in Durable Growth
Operating expenses are often the crux of a growth-stage company’s strategic decision-making process. And with capital being more expensive than ever today, how you spend matters just as much as how much you spend.
Durable growth hinges on operational efficiency, which requires a high level of discipline in aligning dollars to outcomes and maximizing return on every hire, campaign, and initiative. It requires companies to make intentional, ROI-driven choices across three core categories:
- Sales & Marketing (S&M): The engine of topline growth, but often the first place overspending hides. As you’ll see below, durable companies tie S&M investments directly to pipeline conversion and revenue impact.
-
Product & Engineering (P&E): For durable growers, this spend reflects maturity. Lower P&E as a percentage of revenue often signals a strong core product that requires fewer resources to maintain or extend.
- General & Administrative (G&A): This is often seen as fixed overhead, but in reality, is a major driver of efficiency. Durable companies show leaner G&A while maintaining operational excellence.
Let’s dive deeper into each of these categories.
Sales & Marketing Spend
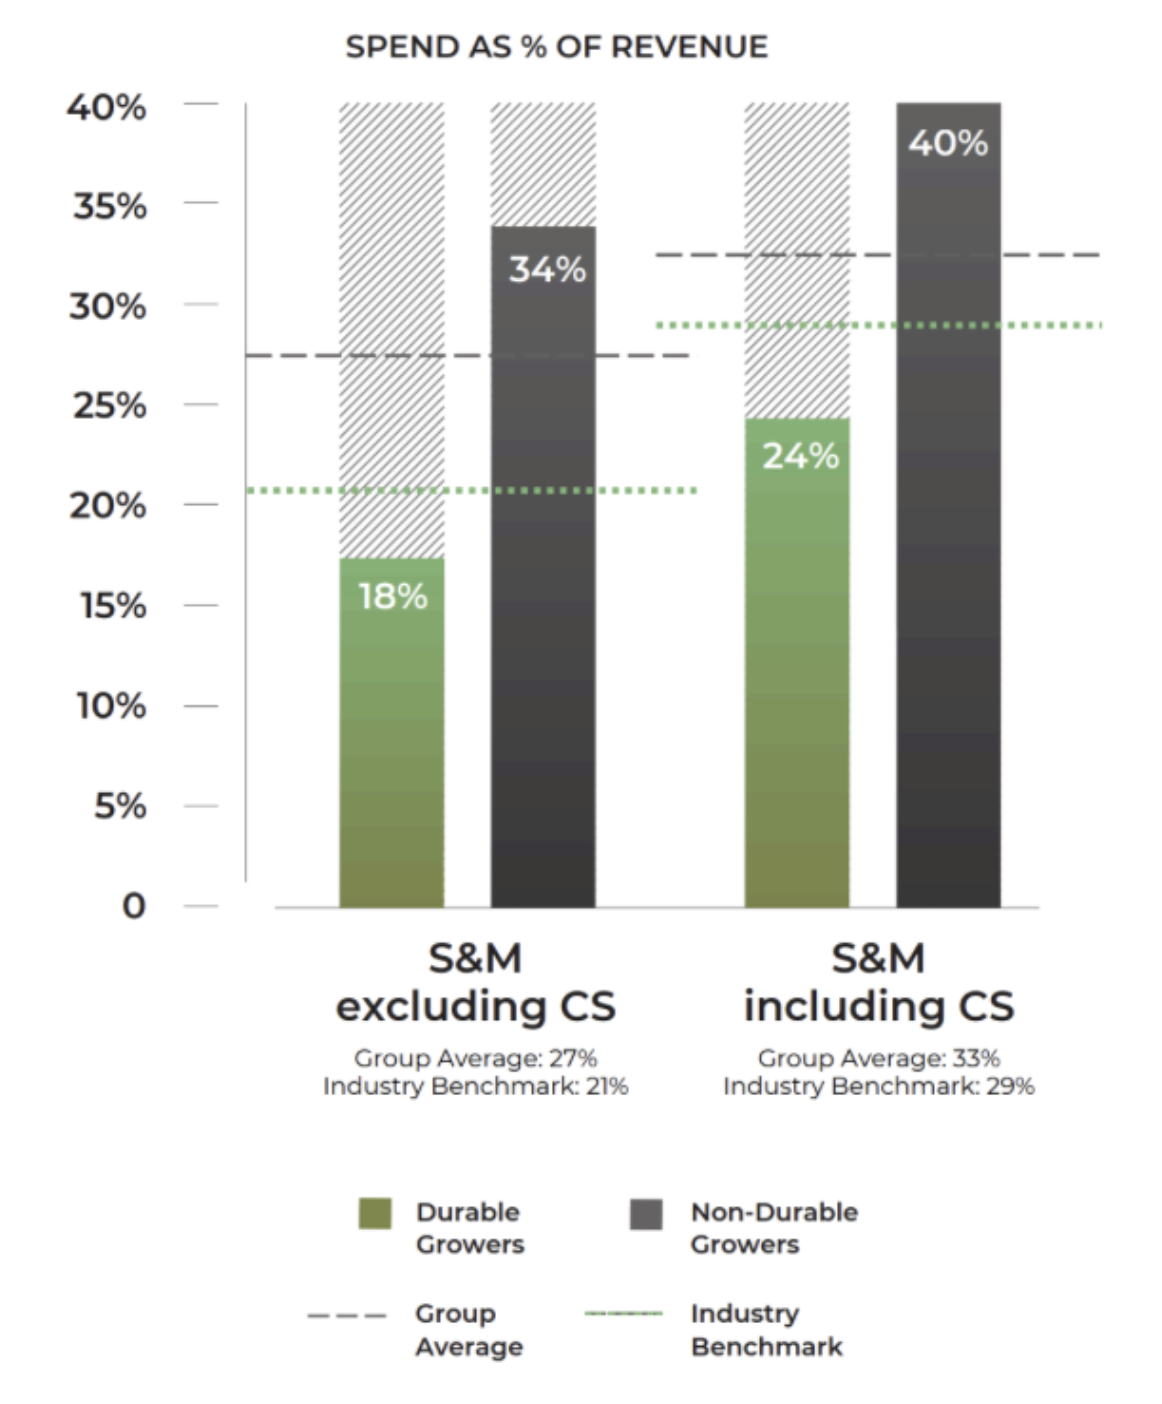
Out of all the levers we explored in our Growth Index analysis, S&M spend showed the highest differential of impact between durable and non-durable growers. With or without inclusion of Customer Success, durable growers are roughly 50% more efficient in S&M expense as a percentage of revenue.
Not only are durable growers spending less on S&M, they’re also spending smarter, generating 2.7x revenue growth per dollar of S&M spend and 16.2x revenue growth per prior year’s S&M spend.
If you’re unclear where you stand when it comes to S&M efficiency, look at key leading indicators like pipeline conversion. If these metrics are falling flat despite high S&M spend, it may be time to take stock of what is and isn’t working and reprioritize accordingly. (For more insights on S&M spend and go to market efficiency as they relate to durability, check out this blog by Operating Partner, Ryan Tognazzini.)
Product & Engineering Spend
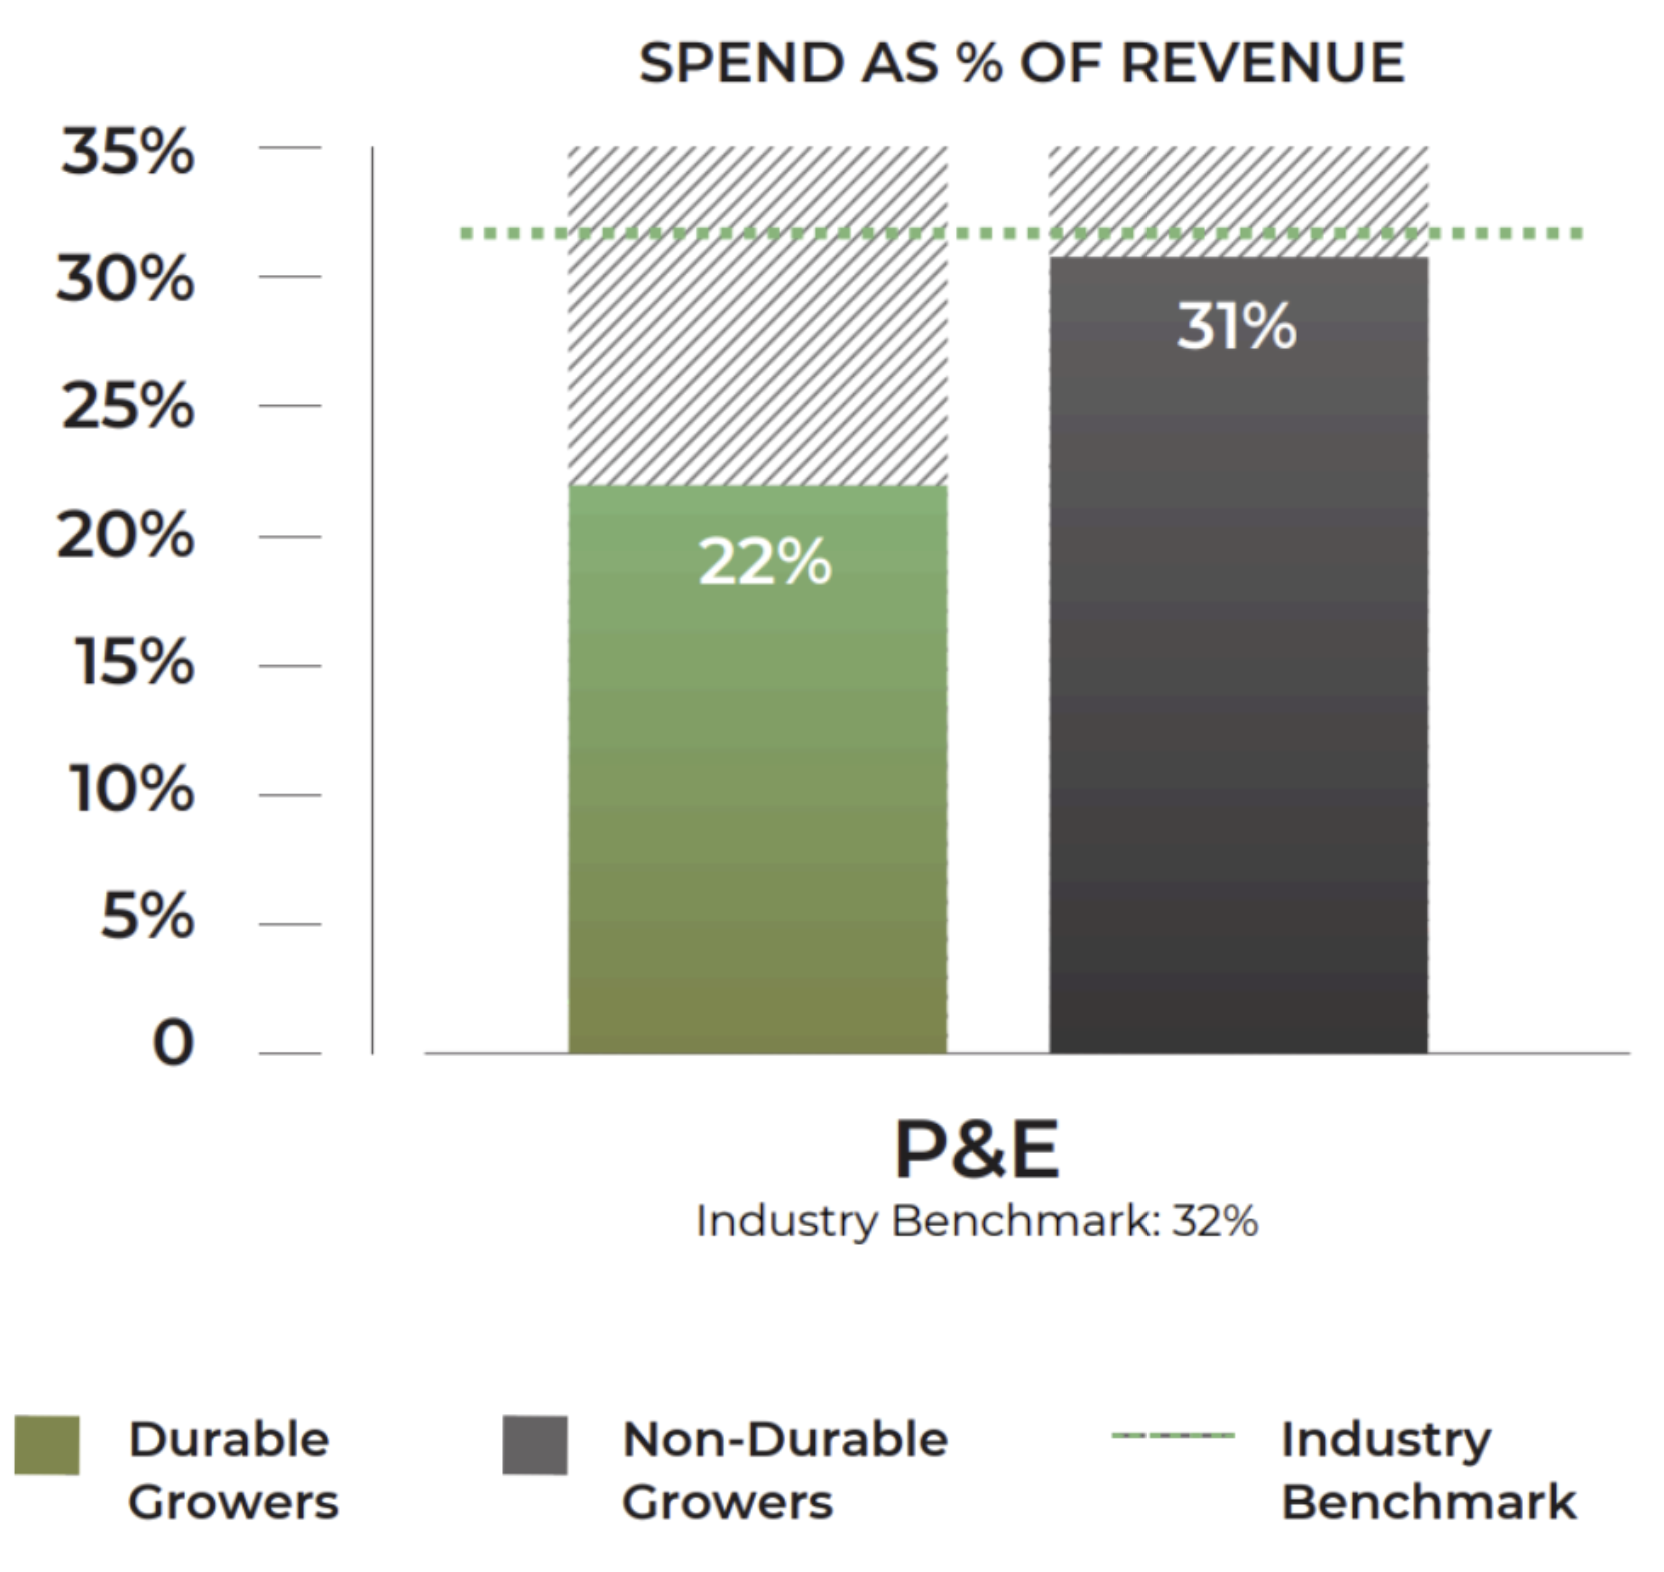
Growth Index survey participants’ average P&E spend as a percentage of revenue was 27%, with durable growers averaging 22%. Non-durable growers averaged 31%. This difference suggests that durable growers have more mature products, meaning their engineering teams can spend less time on building and fixing and instead focus on targeted product improvements.
Also noteworthy, durable growers generated a smaller portion of revenue from professional services (2% vs. 10%), indicating a more developed core product and, consequently, fewer human dependencies.
To pressure test your P&E spend, look at KPIs like feature adoption and NRR. If these numbers are low and your P&E spend is high, you might want to adjust your strategy to focus on necessary product improvements.
General & Administrative Spend
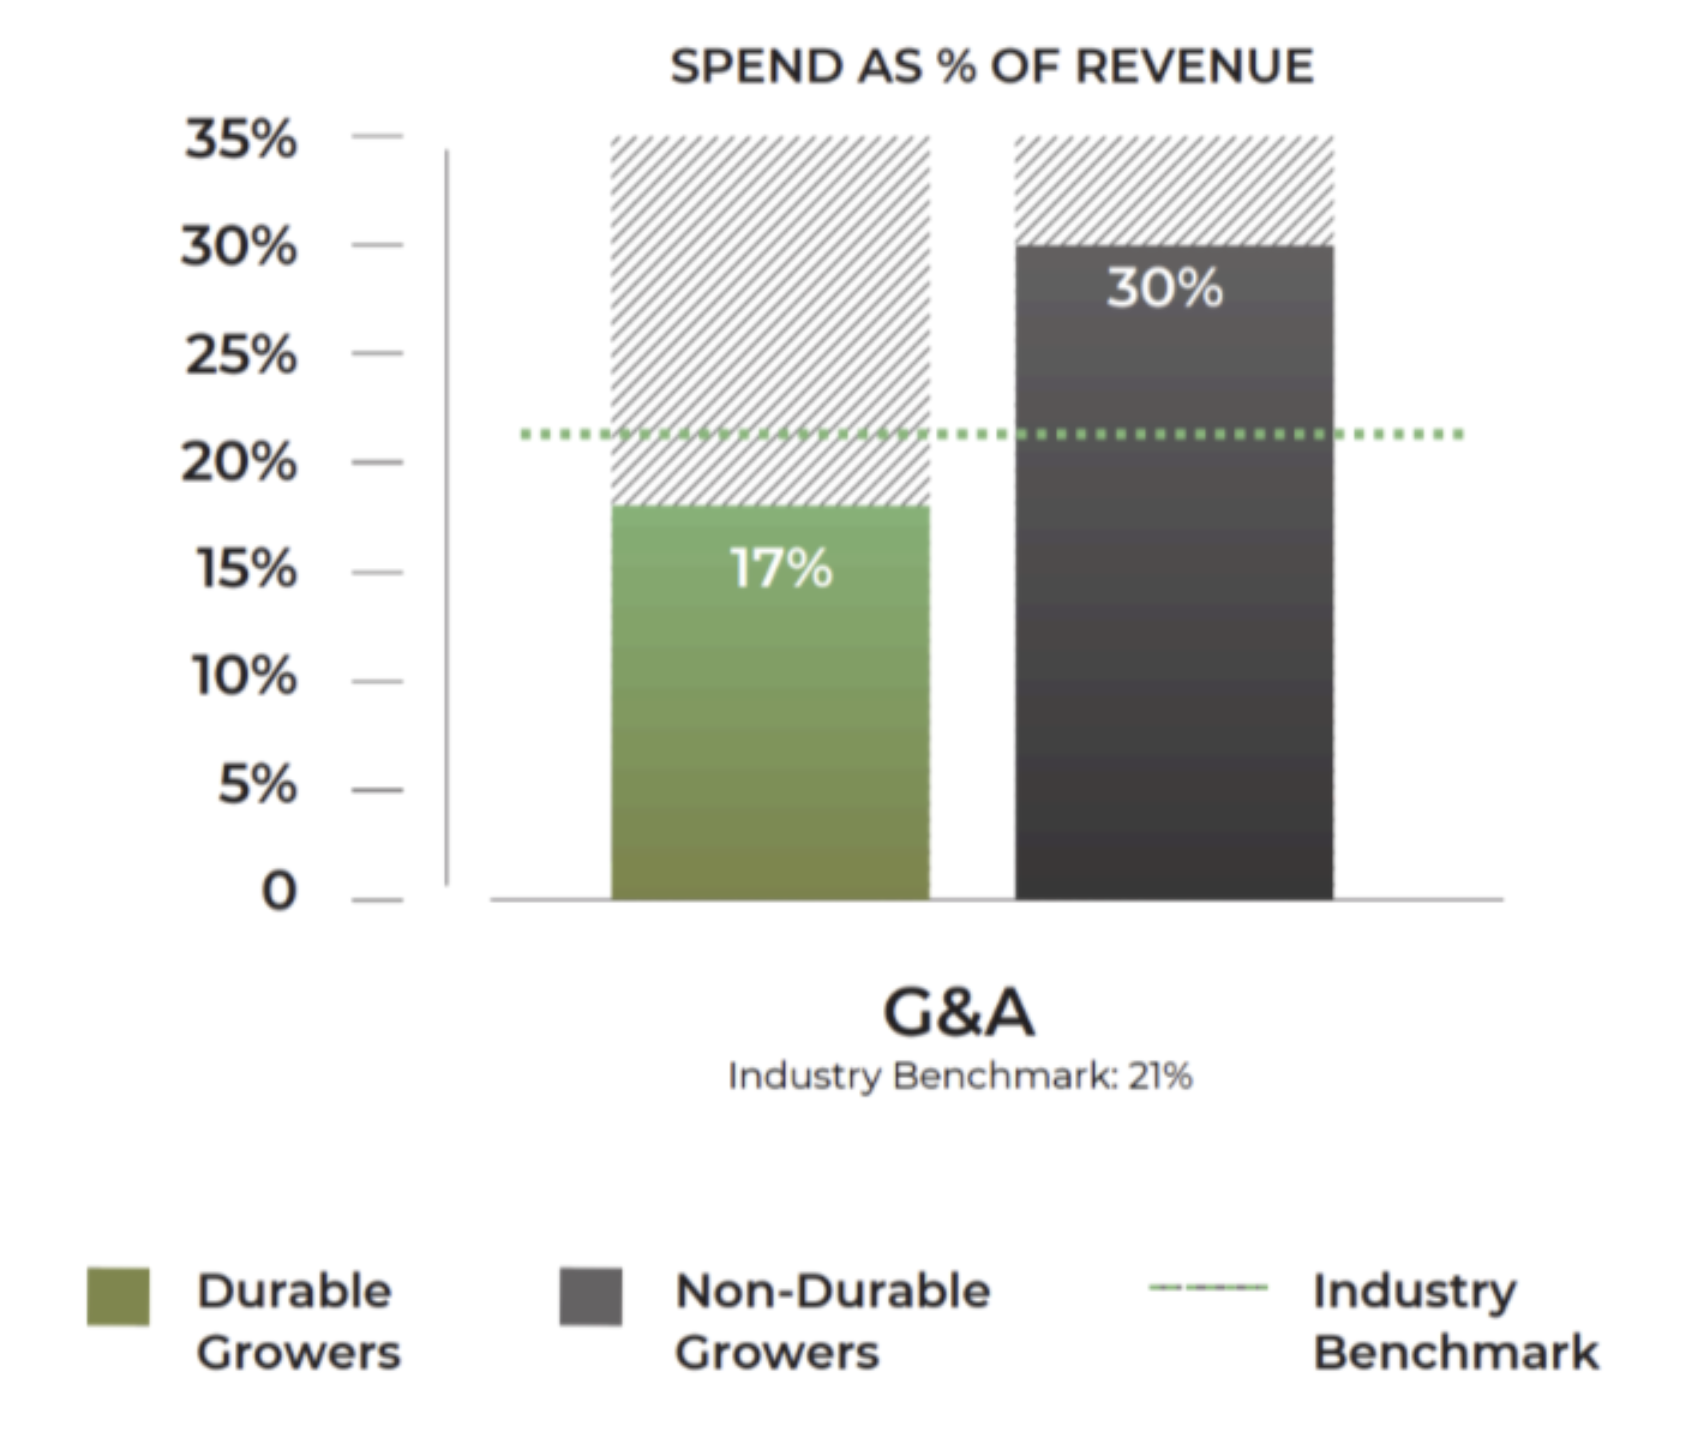
Durable companies also run leaner on G&A, averaging 17% of revenue vs. 30% for non-durables. This is likely the result of durable growers getting greater leverage from tools, automation, and cross-functional teams.
And it pays off: durable growers average 2x higher revenue per FTE, showing that streamlined operations lead to real output gains.
If you’re experiencing G&A bloat without proportional operational productivity, start by auditing your overhead functions against output. Are teams spending time on scalable, high-leverage work? Are systems in place to reduce manual tasks? Look for opportunities to consolidate roles, automate workflows, and hold each function accountable to clear productivity metrics.
Rebalancing OpEx for Durability
If you’re looking to improve your operating expenses to drive greater durability for your company, remember that efficiency does not necessarily mean austerity. Durable companies don’t focus on making cuts so much as they do on prioritizing revenue per expense dollar.
Begin by defining leading indicators against which to test your growth bets (ex: new channels, ICP expansion, NRR, etc.). Then, evaluate each operating expense based on its impact on these metrics. Based on your findings, begin to shift investment from bloated functions to areas with clear, measurable ROI.
Durable companies understand that OpEx is a highly controllable path to capital efficiency and thus leverage it as a growth enabler (not just a cost center).
For more insights into durable growth, download the 2025 Growth Index.