


Revenue per Employee is a metric that I find in most financial models. It’s a quick and dirty method to check whether the company has appropriate staffing for its stage. However, many investors believe it’s not a great benchmark for growth nor valuation.
I agree with that sentiment – revenue per employee is too broad to drive useful conclusions about a company, and CFOs should take it one step further to inform projected profitability and/or cash burn.
Note: In the blog referenced above, the revenue per employee guidance was in the $190K-$210K range. I typically prefer to see more out of Edison’s portfolio companies (and like to use wider ranges to reduce the chance of being proven wrong), so the guidance I give is $200K-$250K.
CFOs can take Revenue per Employee metric to the next level by using a few more basic assumptions following these five steps:
Step 1: Set revenue per employee goals (or bookings per employee)
In this example, let’s use the conservative end of my range: $200K.
Step 2: Set expectations for the average cost for employee
Let’s say the average salary at your company is $100K and you layer in an extra 30% for taxes, benefits, T&E, and the fact that it makes our calculation clean and easy. So our assumed cost per employee is $130K.
Step 3: Determine the ratio of employee to non-employee expenses
I’ve seen anywhere from a 50/50 split to 80/20, and employee costs are almost always the majority of OPEX. So let’s use a ratio of 65/35, favoring employee expenses.
Step 4: Open Microsoft Excel.
We probably should have started with this…
Step 5: Run the numbers:
If you would like to run your numbers, you may download this basic calculator here.
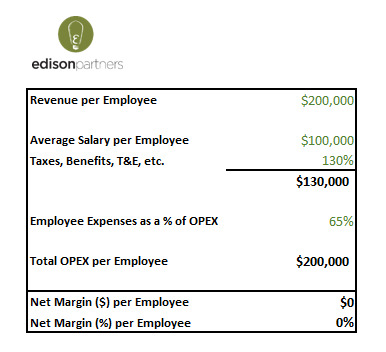
Boom! In the example above, we’ve created a plan to breakeven. If we can execute on these unit assumptions (much easier said than done), then we have a scalable SaaS business model.