


The week ten memo that was sent to our CEOs across the country on Sunday, May 10:
Triangles are sharp, sturdy structures. Each side supports the other two sides. Egyptians used triangles to build timeless monuments amid hellacious sand storms. Triangles are also an effective communication and measurement tool across an organization. You can derive and describe the critical interdependent relationships of people and things with a simple triangle. And they will sustain in swan storms as much as sand storms.
One example during 2008/9 is when we needed to pivot from a field- and event-centric sales and marketing model to an “inbound everything” model; we also had tight bank covenants. Our CFO placed us under trip wire constraints that would ensure no covenants default. It was like house arrest in our own company - a different kind of quarantine. We reduced over 40 sellers to less than ten with four inside sellers and a few field sellers. We cut 75% of the marketing budget.
Since our leadership mandate was to find a profitable, repeatable formula to execute within the reality of a suspended field operation, we invested in an inbound strategy.
Inbound everything meant we needed a product, or a portion of the product, that was “right for me right out of the box.” Inbound everything meant creating remarkable content to trigger organic leads instead of paid search leads. It meant an inside sales operation that could acquire, upsell, and cross-sell their way to the targeted average selling price profitability (ASP squared). We became “innovation angry” in a hurry.
We decided to call this new strategy and execution plan the “Iron Triangle.” Iron because iron is hard to bend, disfigure, or melt. Triangle because we found the three most important angles for our sales and marketing model pivot.
The three angles of our iron triangle were funnel conversion (or what I called the “The Grinder”), Cost Per Lead (CPL), and Average Selling Price Profitability (ASP²).
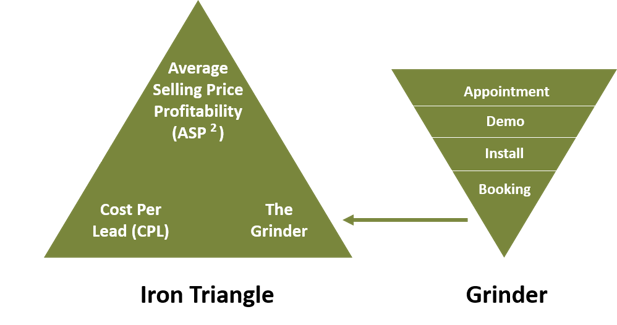
On any given day, you can affect two of the three sides of the Iron Triangle. How?
- Deliver a compelling tool and analysis for calculating Total Cost of Ownership (TCO) during a recession. Use this tool to create content that earns third-party links to increase your website’s domain authority. Increasing inbound website traffic will thus reduce your CPL and ultimately increase your ASP².
- - Deliver a better UX experience in the next release, so your demo-to-trial conversion rate also increases. An improvement of 20% in the Grinder affects ASP² significantly. Since you have a daily Grinder dashboard, you can capture the exact positive impact of your UX enhancement. Note that this applies to cross-sell and upsell as much as it does for new customer acquisitions.
There were two additional benefits from this single triangle picture. The cross=functional teams could be tied together on a weekly basis for KPIs and ultimately bonuses. A 10% improvement in cost per lead or achieving the 20% increase in grinder conversion was easy to calculate. The weekly dashboard supporting the triangle gave everyone equal understanding and impact on leads, conversions, and deal flow profits.
The return on investment of the iron triangle kept increasing once we passed through the 2008/9 knothole and crossed over to the growth side of the economy. We were adding sellers, content and best practices at each stage of the grinder. Our four inside sellers grew to over 60 by 2012.
Additionally, we had another surprise upside. All this interdependent mapping and instrumentation unlocked speed and efficiency in a replenished field salesforce. The field sellers became more self-sufficient in the value prop pitch and followed the same motion with their named accounts. We were operating two streams of ASP profitability; one with the inside team and one with the outside team.
Creating this simple picture with a triangle helped our company recognize what needed to be changed to achieve lasting results in a difficult time.
Digestible diagrams with metrics that ensure organizational alignment, connectedness, and interdependence can be a step toward success. Sharing process relationships empower teams to know best how to optimize results across all connected workflows.
We are here Monday to Sunday.
Sincerely,
Edison Partners